GLADoS
I suspect it's a rite of passage for HI astronomers to write their own source-finding algorithm. Here's mine, which you can download for Python 2 here and for Python 3 here. It's just a couple of Python scripts inside a zip file, plus the STILTS java file. Installation instructions for the required STARJAVA/STILTS packages are included, though you can also just use your system-installed java plus the provided STILTS file. An older IDL version, which doesn't have a GUI or most of the other nicer features, is also available here.
Note that the Python 3 version is a bit of a quick hack. It comes with additional instructions for installing Python with tkinter and adding the astropy, numpy, and matplotlib modules, if your Python install is lacking these for whatever reason. However, I don't like the tkinter GUI and on the longish term I plan to replace this completely.
How it works
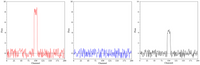
The idea for the Galaxy Line Analysis for Detection Of Sources is actually quite simple. The 21 cm emission line of neutral atomic hydrogen is unpolarised, meaning the waves are oriented in random directions perpendicular to their line of travel (this page has a nice diagram). The radio receivers generally measure polarisations along two orthogonal angles. Being unpolarised, any genuine signal should have equal strength in each polarisation.
Now the clever bit : the noise should be uncorrelated between the receivers.
That means while real signals should have about equal strength in both polarisations, noise is likely to vary substantially. It's not guaranteed, especially for weak signals. But it's a good starting point, and an excellent way to eliminate single-channel spikes in the noise that can otherwise plague source extractors. Strong spikes are especially problematic because if they're strong in one polarisation, then even if they're completely absent in the other, then the averaged cube (which is what we normally look at because it's more sensitive) will still show a signal.
The process that GLADoS goes through to turn this from a principle into a working source-finding routine is described in a bit more detail here (and in this paper, section 2.2). It doesn't do anything fancy and for good reason : I found that Polyfind's approach of seeing if the candidate signals looked like a set of template spectra was horribly complicated and just didn't work.
In brief...
GLADoS begins by examining the more sensitive averaged cube. In each pixel it extracts a spectrum and looks for peaks above a S/N threshold, and if any are found, it then checks the individual polarisations for corresponding signals. It searches these over some user-specified range of velocities rather than only checking the exact same channels. You can also supply individual polarisation cubes with bit of extra smoothing to increase their sensitivity.
The mismatch allowed between the two polarisations is rather liberal. The reason for this is that the most interesting sources tend to be the faintest ones, and I prioritise completeness over reliability. Since real sources have finite width, when they're close to the noise level it pays to be a little bit generous with the matching criteria, otherwise faint sources could easily missed in the less sensitive individual polarisations. GLADoS also measures the approximate velocity width of the source, which is another criteria it takes into account for designating something a candidate, but this really is a very crude estimate indeed.
After this core part of the process GLADoS does a few more things. It uses the STILTS algorithms to combine candidate detections in close proximity to each other, reducing them down to a single peak S/N position in each clump. It also extracts sky and PV maps from the HI data cube as well as a full map of the pixels initially classed as detections before this merging process. All of this is returned to the user in the graphical interface shown below. So the user goes through only the spectra of the merged candidates (the brightest bits of each clump), but they still get to see the initial detection candidates as well. This helps show when the merging might have been over-zealous and combined clumps which are actually likely separate objects.
Using GLADoS
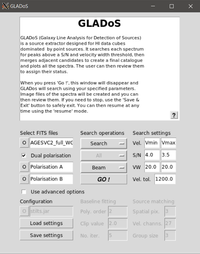
GLADoS comes with instructions, but if you want to see what it looks like before trying it out, here it is. First you set up everything in the main screen. You specify the location of the main FITS file and (optionally) the two independent polarisations, as well as the S/N thresholds for detection in each case, and similarly the velocity widths. And that's all, really. Everything else is largely just detail. For example the default operation is just "Search". If you run this it will make a catalogue of candidate detections, but to inspect them you should either set this to "All" (if you haven't yet run a search) or "Review (if you already did the search).
Review mode brings up another screen :
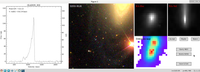
The key part is the panel on the right. From the start I've accepted that this sort of thing is never going to be better than semi-automatic, having experienced the joys of a source extraction algorithm with 3% reliability first-hand. For this reason the review panel lets you group the sources, moving their catalogue data into accepted, rejected, or uncertain folders, as well as querying NED and the SDSS data at the corresponding position as supplementary data.
How well does this work ? Well, quite ! It's a simple, reasonably fast technique (even without parallelisation) that gets respectable levels of completeness and reliability even at low S/N levels. I personally wouldn't use this or any other algorithm as a substitute for the billions of years of evolution behind the human eye, but as a supplement it's worth doing. It nearly always picks up at least a few credible candidates I'm surprised I missed.
The future
As mentioned above, GLADoS remains in an under-developed state, especially the GUI which is rather crude. Possible upgrades to GLADoS would be a curve-of-growth analysis for a more accurate velocity width estimate, and a way to search for signals that exceed the integrated S/N rather than simple peaks. As well as aesthetic improvements to the GUI I'd also like to move to a system where you assign labels to the sources rather than moving them between catalogues, so you could go back and forth at will and not have to review the whole lot every time you realised you made a mistake (though you can at least limit this to each of the three categories).
The problem is that source finding algorithms always sound simple in theory while in practise they tend to spiral out of control, which is why this one has been left somewhat fallow. Writing a source extractor is best described as one of those experiences which is character building, good for the soul... great to do once in a while, but you wouldn't want to do it all the time. Even so, this one is pretty high up the priority list, so a new version might be feasible in 2025.