Hydrogen Skies
I used to have a strong bias in preferring images that would show me "what I would see with my eyes". That is, if an image didn't have colours as they would appear to me, I would think of it as being somehow less real. And I have to say that years of professional radio astronomy has not entirely cured me of this. I still look at enhanced-colour images of Pluto and want to know what it would look like if I was there.
But these days I do at least tend to think of this as a bit more irrational than I once did. Human perspective is no more or less valid than that of other animals who can see completely different wavelengths, or indeed of the colour blind or tetrachromats. Just because we can't see X-rays with our eyes doesn't mean the gas in the heart of giant galaxy clusters isn't real ! So in this project I wanted to show that the night sky would look if anything way more interesting if we had radio vision. If you could somehow peer through a radio telescope, what would you see ?
(You would not of course choose to listen to the data, probably. This is a popular myth from movies; in reality, radio telescopes make images just like at optical wavelengths, only we get typically thousands of images at each part of the sky, all at slightly different frequencies. Radio light isn't fundamentally different from light, it's all photons just of different wavelengths.)
Again full details are given on my blog, but in brief, what you're seeing the sky as it would appear at different locations through a radio telescope. Exactly what you'd see depends on the precise frequency you chose as well as the time of day (because of the rotation of the Earth, which is here sped up just so you can see more of the sky at each location). The accuracy in terms of the direction is very rough, based on the approximate location and viewing angle, all done by eyeballing without knowing the exact numbers.
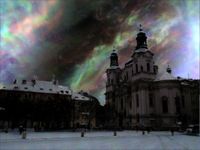
Frequency-wise, all these sequences using my favourite gas, atomic hydrogen, which radiates at about 21 cm wavelength or 1.4 GHz. The colours are generated by mixing red, green and blue channels from slightly different frequencies – it's all still atomic gas, just moving at slightly different velocities. The images use a mixture of the LAB all-sky data, which is quite low resolution but has the full frequency information available, and the GALFA-HI survey, which is much sharper but only a single image was provided so I have no control over the colours in that case.
In some sequences using the LAB data I step through the different frequency channels, equivalent to tuning the dial on a radio receiver. "Channel" in both home radio sets and radio telescopes means essentially the same thing : the precise frequency to which the instrument is tuned. It's just that one is set up to give audio and the other visual output, and we use "channel" as a synonym of "station" (e.g. BBC Radio 4, Classic FM, etc.) by convention. Some stills (more on the blog) :
Prague, Old Town Square
Washington D.C.

Mexico City

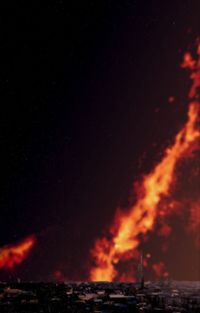
The Magellanic Stream
Depending on the exact frequency, the images show different parts of the galactic disc in which we live. But the LAB data goes beyond this to include some of the other galaxies in our Local Group. One feature in particular is absolutely spectacular : the Magellanic Stream, a huge bridge of gas extending from the Magellanic Clouds. These are two large-ish dwarf galaxies, much smaller than the Milky Way but with a stream that's one of the largest of all such features known anywhere. If we could see it with our eyes it would extend over more than half the sky. Although the brightest part would only be visible in the southern hemisphere, we could see a large part of the tail even from sites in northern Europe.
Cardiff

Prague
Sydney
