Non-Cartesian Data
Virtually all volumetric FITS data I work with is in Cartesian coordinates : linear x, y, z positions. But there are cases where other coordinate systems are used, for example, spherical polar coordinates are used for mapping all-sky observational data and also for numerical simulations of discs (where stuff outside the disc doesn't matter).
Displaying arbitrary coordinate systems directly
I've developed two ways of visualising such data. The first is a Blender-based experimental technique that uses UV mapping (nothing to do with the radio astronomy UV coordinates used in interferometry !). What you do is first import the data onto plane meshes, as with importing volumetric data, using the spherical polar coordinates to create a Cartesian setup. For example you might map the data's θ coordinate as the x-axis, r for the y axis, and φ for the z-axis. Effectively you pretend the polar coordinates are really Cartesian.
Then you subdivide the meshes fairly heavily and UV map the texture. This effectively causes the image to "stick" to the nearest vertex. Knowing the spherical polar coordinates of each vertex from their Blender position, you can then transform them to their true Cartesian position, and the texture gets magically transformed along with them.
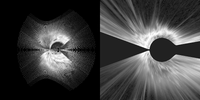
 Example that starts with the data in its native spherical polar coordinates and then wraps to the true equivalent Cartesian coordinates.
The advantage of this is that no data is lost at all during the conversion. If you need accuracy you can subdivide the mesh to get a grid of one vertex per pixel and ensure a perfect transformation. If this isn't so important (and usually it isn't), you can use fewer subdivisions and still get a visually indistinguishable result. And you can do the same, in principle, for any coordinate system at all. Of course the more complex the system the more complex the problems of the orientation of the view, and the reverse angle problem still applies. For instance with spherical data, you now need one set of spheres for looking inwards and one for looking out, rather than from the front and one from the back. For this reason I've developed this technique no further than the proof-of-concept stage.
I developed this approach for an ill-fated job interview. You can read all about that and more details of the technique on my blog.
Converting to Cartesian
There's another option though : to simply convert the data into a Cartesian system through standard formulae. Cartesian data is, for all sorts of reasons, generally easier to work with, and this can be applied mathematically to the data itself without involving Blender at all. Now this gets a little awkward, because there's no guarantee that the r, θ, φ coordinates will map to unique positions on the x, y, z grid, because the cell sizes will be different. In fact they almost certainly won't, so if you start with the polar coordinate data and transform it to Cartesian, you'll end up with a lot of ugly gaps even though you've transformed the entire data set.
The solution eluded me for an embarrassingly long time but turns out to be quite simple. Do it the other way around. That is, convert the Cartesian coordinates to polar and use those to find the nearest data value. This means you go through every single data point in the Cartesian grid and guarantee that it will be filled. This performs, in effect, a very crude but effective interpolation of the data. It also means you can start with a Cartesian grid of any resolution you like, it'll work just as well. More details can be found on my blog.
Of course if you're using n-body rather than volumetric data, you won't have that issue. For catalogues of galaxies, for example, you can just apply the usual polar/Cartesian coordinate conversion directly and everything works fine. Note also that the above example images show position-position-velocity data, which has some particular complications that result in the big gaps in the right panel.