Stacking Galaxies
Not all galaxies contain HI gas, but many aren't detected only because our surveys aren't sufficiently sensitive. But at first glance there seems to be an obvious, easy way to get around this. Take the spectra of your undetected galaxies and combine them, giving you the equivalent of a much more sensitive observation without having to get any new data at all. Brilliant !
This process of "stacking" does basically work. But as I mention on the source cataloguing page, while it seems to get around the hard sensitivity limit of the original data, this is misleading. Strictly speaking it does do this, but only in a very limited way and with a severe penalty. This is often misunderstood, and to me at least it's not at all intuitive, so here I'm going to explain exactly what's going on. Part of this page originally appeared on my blog.
The Basics
An HI spectrum, like all spectra, is just a plot of flux (that is, brightness) as a function of frequency (usually plotted as its directly equivalent parameter, velocity). Consider the ideal case. We have two observations of the same galaxy, of a similar sensitivity level, which happen to just about detect it. Since the signal is so weak, it's hard to say exactly where in the spectrum the galaxy emission ends and the noise begins – we can't accurately measure how fast it's rotating, which is annoying. But if we take the average of the two spectra, we've made the equivalent of an observation with double the observing time. This can help quite a lot.
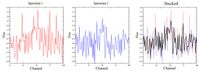
... well, okay, a little bit. If you look carefully, the values of the stacked data are generally less noisy than the individual measurements. But two spectra aren't really enough to show this properly. Sensitivity scales with the square root of the integration time, so double the time and you only get 1.4x more sensitive. But if you have a hundred spectra, you'll get ten times better sensitivity. That can reveal emission that was utterly undetectable in any individual spectrum !
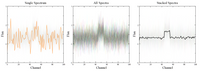
In the above example, we can see something in an individual spectrum, but you'd be laughed at for claiming you'd detected anything. Showing all 100 spectra together reveals the source far more clearly, which is borne out by the actual stacked spectrum.
But the consequences of this are not as simple as it may appear. To understand why, we need a little mathematics. Suppose that the noise level (rms) of each spectrum (numbered i ) is identical. Formally, when we stack spectra in this way, the noise level of the final spectrum will be given by :
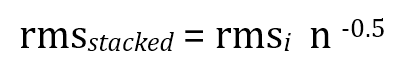
Where for rmsi we can use any spectrum since all rms values are the the same.
Before considering the more surprising results of this, we should note some practical considerations that in real-life we cannot avoid. For stacking undetected galaxies we need to know their frequency (velocity), which we can generally get from optical data. With this, we can adjust the spectra so that we're stacking the channels corresponding to the same velocity in each case. This is trivial, no more complicated than clipping the spectra so they span the same velocity range (provided the observational data are otherwise identical). But if we don't know the velocity, the situation is hopeless and we should just give up at this point.
Similarly, in some spectra we might have strong sources at different velocities from that of the target but within the range we're using for stacking – these channels may need to be clipped. At low velocities we might include the Milky Way, which across the entire sky. And different galaxies have different spectral profiles, so in some cases we may be averaging channels containing emission with those containing noise. All of these can limit how many galaxies are actually available to us for stacking and affect the final quality of the result.
As long as we manage our expectations, though, this is fine. We can absolutely answer the basic question of whether an undetected sample does contain some level of gas or not; we can't expect to say much about the precise characteristics of the gas in that sample, however. The central velocity channel of a galaxy might not always contain the peak of its emission (usually it does not), but it pretty nearly always contains some. So we'll be able to get a signal, even if not of terribly high quality.
A really crucial point : that equation applies more generally. The same process is at work during an actual, single observation, replacing n (number of stacked spectra) with t (integration time). It applies also when we smooth data spatially or spectrally. "n" really means the number of elements being averaged, be those elements entire spectra, pixels, or duration.
With all that in mind, we can now consider the idealised case to examine what the results of this procedure really mean.
The Subtleties
The key is that the stacked spectrum is an average. If we've used stacking as it's usually used, for stacking undetected galaxies, it tells us about the average amount of gas that can be present. If our stacked spectrum is a non-detection, it means that the average mass of gas present per galaxy can be no more than this (we would define the sensitivity limit in the usual way as for individual sources, e.g. by assuming some maximum velocity width and S/N of the signal). Some galaxies could have a bit more than this, provided the others have a bit less, by the nature of averaging.
What is absolutely does not mean is that this is the total amount of gas that can be present in the sample. It's very easy to fall into this trap, because for a single galaxy, this is exactly what the sensitivity limit means. But for stacking this is not so. Stacking does of course improve our sensitivity to the average amount of gas that can be present, but it actually degrades our sensitivity to the total mass !
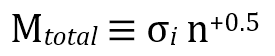
This is easy to show. While the exact relation may be complicated, regardless of what sort of data we're using, mass sensitivity is dependent in some way on the noise level of the data*. The details need not concern us here. What's relevant is that we can express the mass sensitivity of the stacked (averaged) spectrum thus :
* For HI the conversion is very simple.
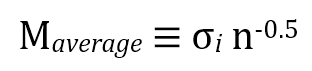
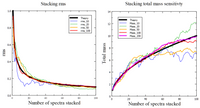
Clearly always decreasing with n, as we would hope ! After all, it's essentially the same as the previous equation. Again, this is a weak function, and to get half the rms level requires an increase in n by a factor four. You need huge increases in observing time for really substantial gains – hence the difference in the above examples of stacking two versus a hundred spectra.
But this is the average mass present. The total is of course simply given by n*Maverage. Which means the -0.5 becomes +0.5, and this makes a world of difference :
This gets worse and worse the more we stack ! To stand any chance of stacking working, you need there to be a weak, undetectable signal present, but it must be present in a very great deal of the stacked elements. If you stack multiple galaxies you need to be confident they're all likely to contain some gas; if you smooth the data to look for diffuse gas, this will only work if it's present over a large area. The upshot is that stacking works well only as long as most of your stacked elements contain signal.
This also explains the special case of why continuing to integrate on a single galaxy does indeed generally work well : the elements do all contain signal, you just need to average the noise down to low enough levels to reveal it. Signal (if the galaxy contains any at all) is always being averaged with signal in this case, which is not necessarily true in other situations.
The Complications
All of the above considers the ideal case of all spectra having the same rms. What if they don't ?
In that case we've got options. If some spectra have very much worse rms than the others, we could consider just not including them. Averaging a low with a high rms is nowhere near as good as averaging those of equal rms (and remember, even this ideal case doesn't gain you much unless you have lots of data to stack), so you can likely get a better rms by leaving out the worse cases completely.
A more sophisticated – though not necessarily better – approach is to use weighting. The amount each spectra contribute to the stack can be modified so that those with the highest (worse) rms contribute the least. This means they still get included but don't affect the noise quite so much. Weighting can be done in two main ways :
- Variance-defined weights mean a spectrum is assigned a weighting factor W according to 1/(rms^2). This has the advantage of being simple and doesn't depend on any prior knowledge of your sample.
- Normalised weights are computed as Wi = rmsmin / rmsi. This requires you already have your entire sample, though normally this is not a problem.
In each case, before averaging the spectra they are each multiplied by their weighting factors, which are always < 1. For the averaging itself, instead of dividing by n, the resulting spectrum is divided by the sum of the weights. Since Wi < 1, Σ(W) < n. More details can be found in this paper.
Neither weighting method has any particular advantage over the other. To compare with the idealised case one can make theoretical estimates of the best and worst case scenarios : e.g. calculate rmsstacked assuming all spectra have the highest and lowest rms values in the sample. There is however no analytical formula, so far as I know, to predict how much better or worse the result will be by using weighting, as this depends entirely on the specific rms distribution in the sample.
Finally, don't forget about distance. For mass sensitivity, which is the most important thing, distance matters too ! If you're stacking galaxies at slightly different distances this is fine, but if the variations are significant, you're doing the equivalent of stacking signal with noise. So you may well be able to improve your mass sensitivity by removing the most distant objects, even though this will actually make your rms worse.