Finding the fluffiest gas
I published most of the stuff I did for my thesis* in various papers, with one major exception. This was an attempt to re-process the Virgo HI (atomic hydrogen) data cubes to reveal really diffuse gas. We know galaxies in the cluster are losing gas, but at the time, we couldn't see any streams. So where had all the gas gone ? How come a very few galaxies had massive, enormous streams, but most had no kind of extensions at all ?
* Those who are really interested in this should read chapter 7. What follows is considerably simplified and massively shortened.
A search for streams
As it turned out, this question did have an answer (or rather several answers), which you can read about on the ram pressure stripping page. But at the time it was weird. So I wrote a little routine that would automatically search for diffuse gas. This is based on the principles of stacking which I explain on the dedicated stacking page. The main point is that when you average different sources together, your sensitivity improves to the average content, not to the total – something I didn't fully appreciate at the time. If stacking is going to work, you have to have a lot of material present. Sure, it can be spread out, but there has to be a lot of it, and it has to be in the vast majority of the targets you stack.
Why my routine did was very simple. It took all the pixels in "every" (see below) possible rectangular area of the data cube and averaged them together. Like so (image found on StackExchange) :
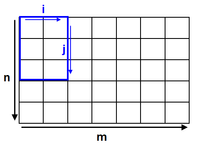
Of course this is a data cube so each pixel is really a whole spectrum, but this doesn't matter too much. The point is that if each pixel contains gas, we should detect it. We didn't. In fact, because the algorithm stacked so many rectangles, I had a subheading in my thesis, "Four hundred million non-detections".
What went wrong ? Nothing and everything. The algorithm was working fine (I inspected quite a few of the spectra it produced, sorted by peak S/N, and they were all very clearly empty), it just didn't find anything.
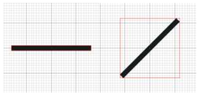
Of course there were some limitations. It didn't really stack every rectangle, just every one that can be formed by varying only the horizontal and vertical size – this is much easier to code than accounting for rotation. So streams at an angle could easily be missed. And it could only run in regions where there were no galaxies present, which severely limited where it could look.
But a more fundamental problem is that whole "averaging" thing. Sure, around galaxies there might well be some diffuse, extended HI emission due to recent stripping. But go a bit further away and that gas is going to change. It's going to heat up and it's going to disperse. Both of these effects means that unless you're searching in just the right area, the chances of detecting anything are really quite remote. As we eventually found, when you look on the smaller scales of individual galaxies, there are in fact many quite clear streams present, but beyond their immediate vicinity... nah. Not in clusters, at any rate.
Flux distribution
Unfortunately I wasn't done yet. This little section should serve as a warning to anyone trying to attempt something similar : don't. No, really, don't. Not even to see what happens.
My supervisor's bright idea was very simple. He suggested that we make a histogram of the flux distribution of the pixels in the whole data set. With the galaxies themselves masked, we might be able to do two things : 1) see if there was any high-flux tail remaining in the distribution, which would be from random pixels which were much brighter than the average (little HI clouds that escaped direct detection); 2) subtract the sum of the negative from the sum of the positive flux values to get the net total flux, which could tell us if on average there were more positive than negative pixels.
Neither of these worked. The latter I think is utterly hopeless, though there might be a glimmer of hope for the former. Here are some of the plots I showed :
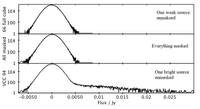
When there's even one bright galaxy left in, we do indeed see this very nice positive tail of values. But when everything we could find was masked... nothing. The noise distribution is a damn good approximation to a Gaussian, just as we'd expect it to be. There simply aren't any small bright clouds that we'd missed. Really bright pixels that stand out clearly from the noise are only found in gas in bright galaxies.
But this exercise is more than just a useful sanity check to see if there were any obvious sources which conventional source extraction methods missed (though it is good for that too). Since the faint galaxy barely changes the flux distribution from the case of masking absolutely everything, it's entirely possible that some faint galaxies and clouds were missed. The trouble is that this technique is self-evidently not a good way to find them, which kindof short-circuits its usefulness.
As for the idea of subtracting the negative from the positive values... nope. It sounds so simple, but I found that the variation in the values between different regions was huge. Sometimes I'd get a value which corresponded to a not-implausible amount of gas, but at other times I'd get much stronger negative values. And this is after all the data cleaning that got ride of all the obvious artifacts and gave us wonderfully flat images.
So be warned. Looking at flux distribution to spot diffuse gas sounds great in principle, but in practise it quickly runs into some extremely difficult problems.
Spectral Smoothing
A much simpler way of searching for fluffy gas is to use good old-fashioned smoothing. If you smooth the data spatially, as above, then of course you loose spatial information, so you don't know exactly where the gas is. Worse, by the laws of stacking (for smoothing is just stacking by another name), you rely on the gas being present in almost all of the pixels you smooth over. So you have to have good reasons to expect some diffuse, all-pervading material is actually present.
In Leo, we tried another approach : smooth the data along the spectral axis. And lo and behold, this actually works.
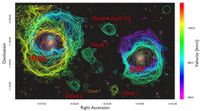
Why ? Well, HI gas exists at a temperature of about 10,000 K, equivalent to a velocity dispersion of 10 km/s. This means the HI line essentially can't be any narrower than this (at least not much). But it can easily be thicker, either due to rotation or just random velocity dispersions. Real galaxies typically have line widths ~100 km/s. So reducing our velocity resolution from 10 to 40 km/s isn't nearly as big a deal as losing spatial resolution : the HI might be spread out spatially, but it's usually spread out in velocity. While this does of course sacrifice kinematic accuracy, this isn't usually as important as just knowing if a cloud exists and where it is. I haven't yet got around to trying this on the other data cubes, so maybe there's even more fun to be had from data mining here !