Virgo.glass
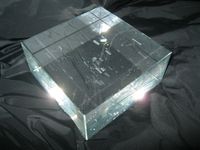
When I eventually published the data I analysed during my PhD, I wanted something physical to show for it. Somehow I stumbled on Crystal Proteins, the website of artist Bathsheba Grossman. So using the first method I ever tried for loading FITS files into Blender, I created a point cloud out of the AGES VC1 data cube. This is very simple, it's just a list of coordinates of wherever the HI was detected at a S/N level of 3 or greater. This, on discussion with the artists, was chosen because of a number of requirements : 1) to show as much of the HI as possible; 2) to avoid having so many points etched in the glass that it would cause a runaway fracture; 3) to show HI throughout the entire volume without obscuring the details.
The final result is a hefty, 14.5 x 14.5 x 6.5 cm, 2.8 kg chunk of mostly solid glass.
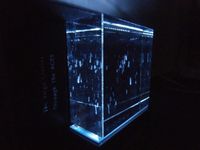
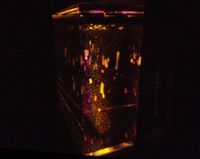
The HI shows up quite a lot more clearly from one side than the other because the fractures are asymmetrical. The data is clearly visible enough in daylight, but it's even better in a darkened room and illuminated from below. Later I found a perfect-sized light stand which also makes things multi-coloured. Which leads to the running joke that the most important result of spending a couple of hundred hours with one of the world's most powerful radio telescopes is that I can activate "disco mode".
The "dataweight" makes for a great prop and I use it at every opportunity. Having a physical object to engage with makes it much easier to explain the data structure, and once everyone gets passed the "what's that ?" stage, people naturally start asking questions about what they're looking at.