PlotCat
Work in progress !
PlotCat began as an experiment to use Codex, the OpenAI coding tool powered by ChatGPT. This is an attempt to solve two long-standing issues that I've always thought should have an obvious solution, but don't : 1) TOPCAT, the awesome astronomy catalogue manager and plotting tool, has a wonderful GUI but lacks the ability to make nice-looking, publication-quality plots; 2) matplotlib, the Python plotting library, is terrifyingly powerful but its syntax MAKES NO DAMN SENSE.
I believe that graphical tasks are fundamentally best done via graphical interfaces. Surprisingly, there's relatively little out that that provides the obvious : a GUI-wrapper for matplotlib to make basic plotting tasks easy.
PlotCat is my attempt at an answer to that. It's heavily inspired by TOPCAT's interface and workflow, especially table management, creating subsets, and (hopefully) simple, clear interface. It is however NOT designed to simply be TOPCAT but written in Python. Rather the point is to bring the focus on to the plotting side of things, providing all the power of matplotlib but via GUI-based menus without requiring the user to do anything so base as to edit code.
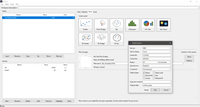
Currently you can load tables, create and edit subsets, toggle which subsets are visible, and run simple online queries using NED and Simbad. Table-internal selection tools (cone search, rectangular search, parameter search) are included. There's also some limited support for matching objects across tables. Eight different plot types are supported, including the specialist astronomy plots of wedge diagrams and sky plots. Each supports multiple layers (i.e. overplotting subsets and different tables)
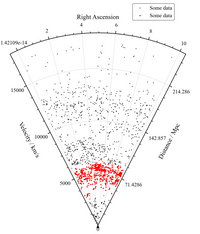
A sky viewer is also included to automatically retrieve images of target objects/positions from the SDSS, DESI LS, GALEX, and other surveys.
You can download PlotCat from its GitHub page. But be aware this is the very first release, completely lacking in a user guide, with limited tooltips, and only a minimum of debugging. Some plot behaviours are inconsistent across different plot types : for example, scatter plots allow you to click the marker in the legend to set a different size from that plotted for actual data, whereas this is not yet implemented for wedge plots. Much more work remains to make this a truly production-capable tool, though it is currently useable in some limited cases.
I hope to implement rudimentary documentation in the next few days. Debugging will follow shortly thereafter followed by feature upgrades. If you're interested in using or working on PlotCat, get in touch using the contact form below or via GitHub.
Note : PlotCat is exclusively written through a process of vibe coding but maintaining a human in the loop. That is : prompt, test, refine, repeat. I have not touched the underlying code manually in any way, so verification at this stage is done via comparisons with expected results. It's entirely possible that it contains some terrible, freakishly large bugs that would constitute a Biblical plague, although I rather doubt it.
PlotCat contains a proper open source license as I've decided I should finally release my stuff properly.